Gold Prices This Week And Next Week's Forecast
By Jim Curry - The Gold Wave Trader - 4/29/18
As mentioned in a prior article, the month of May looks to be a key timeframe for
the Gold market, with several key time cycles that we track looking for a semi-important
bottom. There are also two key turning point and reversal dates for May, with the
first of these being May 4th - which is plus or minus a day or two in either direction.
The second key date comes into play on May 22nd, and which is also plus or minus
a day or two in either direction.
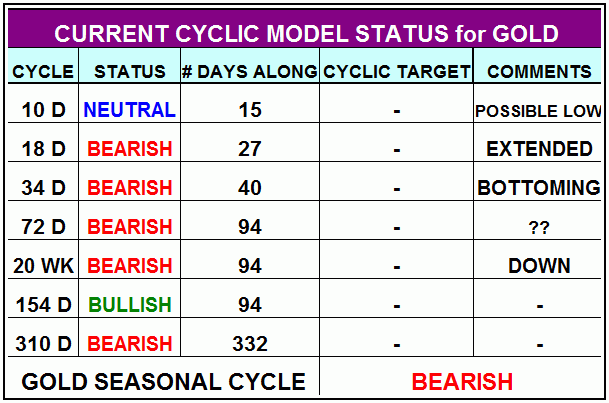
My work is primarily focused on seven time cycles that I track, cycles that have
proven to be dominant throughout the history of the Gold market. With that, we need
to first take a look at the approximate positioning of these cycles, and with that
I regularly publish a table regarding the same, which is shown below:


Please note that the labelings for each particular cycle are only an approximation
of their currently viewed position. That is, I continually adjust these as the market
moves, as the anticipated cycle bottoms and tops come into view.
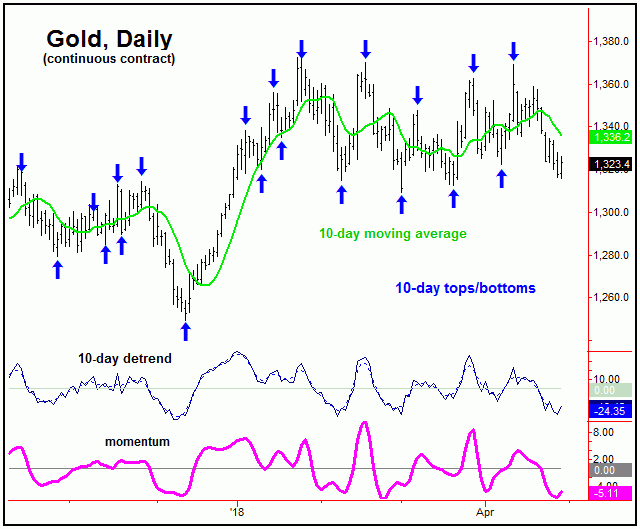
For the very short-term, the most dominant cycles are the 10 and 34-day waves, with
the smaller 10-day cycle shown on the chart below:
Note that the 10-day cycle was still making lower lows into Friday's session, which
means that the cycle is some 15 days along from its last labeled low - and thus is
moving into extended range for a bottom. Once this wave does trough, then my rule
is that a cycle will revert back to a moving average of the same length approximately
90% of the time, and thus a rally back to the 10-day moving average or better should
be the natural expectation for its next upward phase.
With my work, I also publish ‘reversal points' for the cycles that I track, which
are price levels which reverse the cyclic momentum from down-to-up (or from up-to-down).
With that, Gold would currently need to see a reversal back above 1328.50 figure
(continuous and June, 2018 contract) to confirm a 10-day cycle trough to be set in
place, something which - if seen - would also favor additional strength through the
same.
Going further with the above, if the next upward phase of the 10-day cycle is able
to play out before our May 4th turn, then the probabilities will favor the move to
end up as countertrend - against the prior 10-day top of 1369.40. If correct, a drop
back to or below the recent lows would be favored into that May 4th date or later,
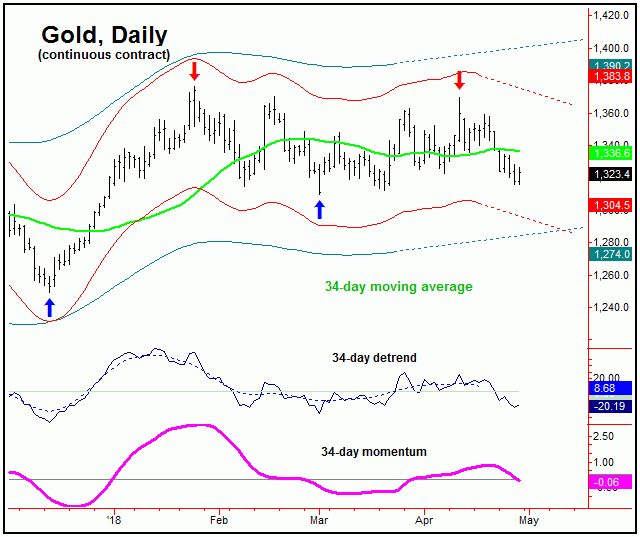
a move which would then be the odds-on favorite to trough the larger 34-day component,
which is shown on the chart below:

The last low for the 34-day cycle was made back on 3/1/18, with the metal bottoming
at the 1309.50 figure - which remains a key price figure going forward. In terms
of time, this wave is 40 trading days along from that low, and with that is also
within normal bottoming territory. Having said that, until a lower level materializes,
it would currently take a reversal back above the 1370.80 figure (June contract)
to confirm this particular cycle to have bottomed. However, this number could (and
should) start to drop sharply going forward, depending on the price and technical
action seen in-between.
Stepping back, as mentioned in a prior article, the next semi-important low for Gold
is expected to come from the larger 20-week cycle, which is shown again on the chart
below:
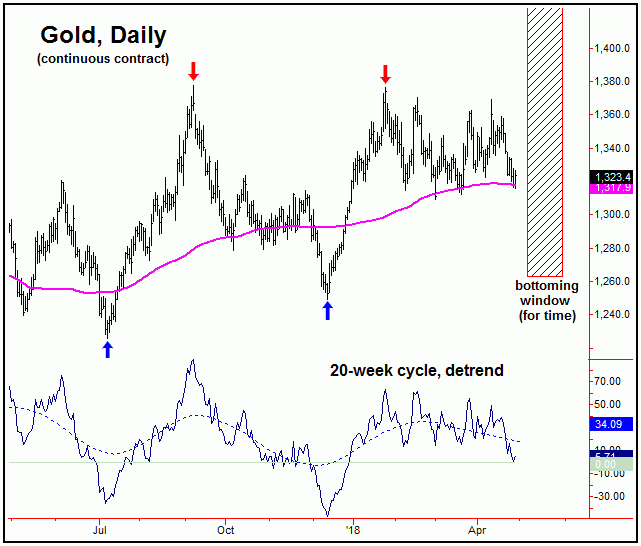
With the above said and noted, the basic analysis is that a short-term rally could
soon play out with the 10-day cycle, and - if that move ends up as countertrend -
could see the metal making lower lows into the month of May. That new low - if seen
- would appear to be the odds-on favorite to trough the larger 20-week cycle, for
what is expected to be a sharp rally into July or August of this year.
In terms of price, normal rallies off of mid-term cycle troughs have, historically,
been in the range of 8-16% off the bottom, thus giving us some idea of the potential
upside heading into the Summer months. For now, the key is whether the 1309.50 swing
low will be able to contain the larger downward phase. If it can, then Gold could
be testing the 1416-1523 region in the coming months. If it can't, however, that
rally will obviously come from lower numbers, where we would have to re-evaluate
at the time.
Going further with the above, the only way to confirm a mid-term low in place for
now would be for a reversal back above the 1370.80 figure (June, 2018 contract),
thus making this our key dividing line for the anticipated rally into mid-Summer.
In looking at technical indications, since breadth indicators are spotty with the
Gold market, I like to keep track of sentiment and COT data as my main technical
guides to this market. The chart below shows my Gold Timing (sentiment) index, which
has actually been on a sell signal since last September - without issuing an intervening
buy signal:
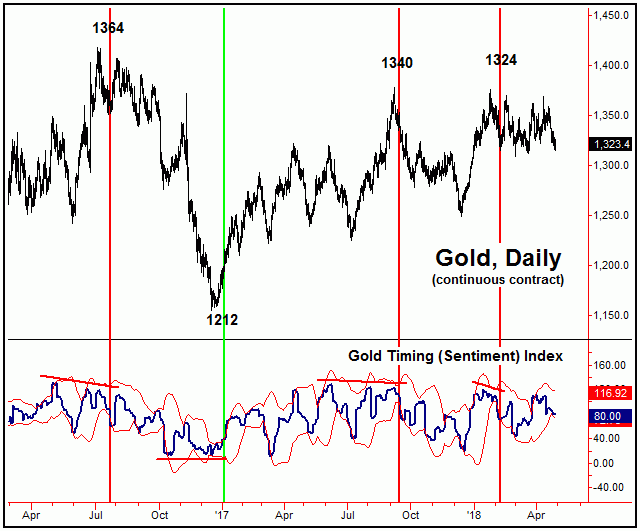
Buy and sell signals with the above come on a divergence between our timing index
and price. That is, a higher price high - along with a divergence in our Gold Timing
index - is normally seen as a bearish indication. However, the actual signal does
not come until the Timing index closes below its lower standard-deviation band.
Conversely, our buy signal setup comes with a lower price low - along with a divergence
in our Gold Timing index. When that is seen, a close above the upper standard-deviation
band is seen as a confirmed buy signal. With the above said and noted, we are waiting
to see if a new signal develops in our Gold Timing index into the expected May bottom.
Until then, the 1370.80 figure (June, 2018 contract) is our key dividing line for
the anticipated Summer rally.
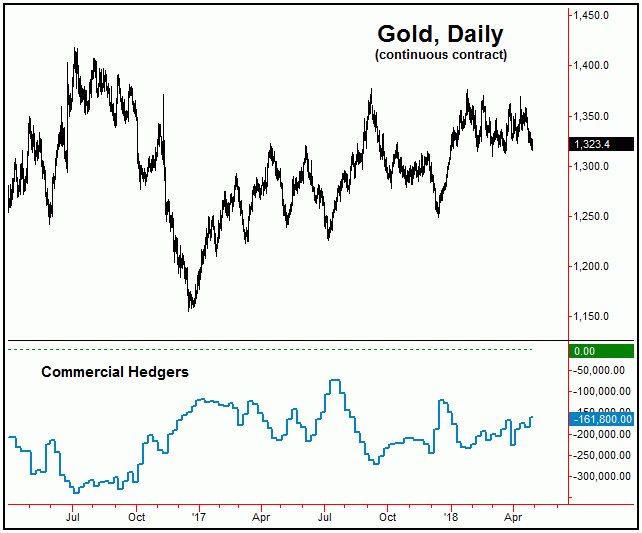
Lastly this weekend, in looking at the COT numbers from last week (chart, above),
the commercial hedgers actually covered some 23,000 of their recent shorts, which
I view as supportive of the anticipated rally into mid-Summer, but only if the 1370.80
figure is traded above - and/or if a new buy signal were to develop with our Gold
Timing index. Stay tuned.
Jim Curry
The Gold Wave Trader
http://goldwavetrader.com/
Jim Curry is the editor and publisher of The Gold Wave Trader and Market Turns advisories
- each of which specializes in the use of cyclic and statistical analysis to time
the Gold and U.S. stock markets. He is also the author of several trading-related
e-books, and can be reached at the URL above.