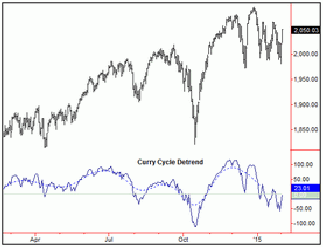
The Curry Cycle Detrend indicator is a simple-to-use indicator for determining where
past cycle bottoms and tops have been registered for any particular cycle. This indicator
is useful, for the analyst who wants to know (1) where these bottoms and tops have
been made in the past, and (2) for being able to analyze the same in detail for future
trading purposes. With this indicator you can quickly ‘see’ the prior bottoms and
tops with any cycle of any length. This indicator is the same one that I use in each
of my market reports.

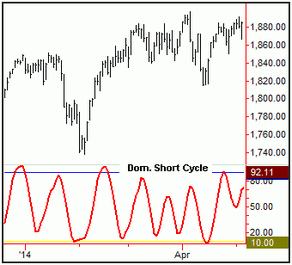
The Dominant Short and Mid-Cycle Indicators are excellent for tracking a regular
occurring cycle of between 10 and 20 bars in length (for the short-cycle), and around
30-40 bars (for the mid-cycle). These indicators are fairly smooth - but yet also
turn quickly after cycle bottoms or tops, about as much as you could ask for. Also,
these indicators work about as well for the smaller timeframe charts as they do for
the daily and weekly charts. They are also helpful for spotting divergences from
prior tops and bottoms.
Cycle Indicators for Tradestation Platform
Over the years I have received quite a bit of email, with the question: “where can
I get indicators like the ones you use in your market reports?”. With that, I have
decided to make available some of the indicators that I have developed (out of necessity)
for use in cyclic analysis. Below is a brief description of the current offerings;
I plan on adding more in the future, as time permits. You can read a brief description
of each, then click on the link for more information and to order.