Market Outlook - June 2, 2014 - Publisher, Jim Curry
Since the prior report from Thursday, Gold has seen additional correction, here dropping
all the way down to a Friday low of 1242.20 – before bouncing slightly off the same
to end the week. As noted in the prior outlook, we are due for at least a short-term
rally with the 10 and 34-day cycles, if not something bigger – such as from the larger
72-day component.
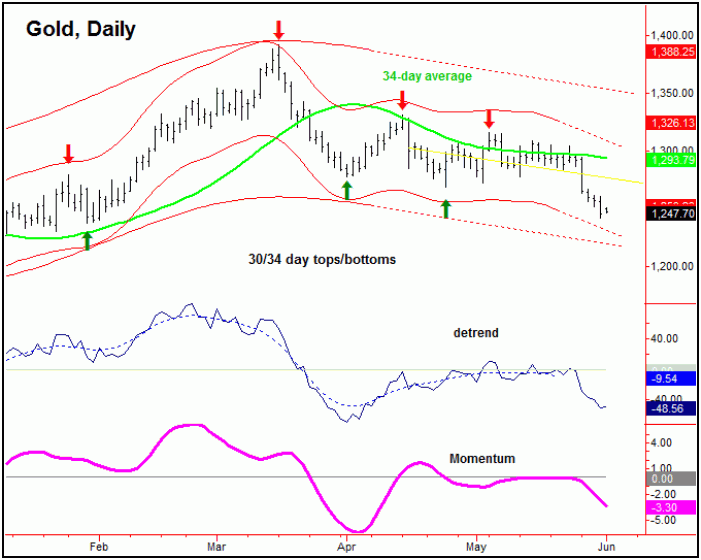
With the above said and noted, any reversal back above the 1262.50 figure on Gold
– if seen at any point in the coming days – would confirm an upturn in the 10-day
cycle, and likely that of the larger 34-day wave as well. In terms of price, that
would mean a minimum rally back to the 10-day moving average (prior page) but, most
likely, would see a move on up to the higher 34-day moving average – with the latter
currently at the 1293 figure (chart, above).
From the 5/19/14 report: “taking out the 1289.00 figure favors the downward phase
of the 10-day cycle to be back in force. If correct then, as noted above the odds
will favor additional weakness in the coming days, with the metal ideally making
a test of the 1277.00 figure in the process. Stepping back, the same 1277.00 figure
on Gold looks to be the current dividing line between up and down phase of the larger
34-day wave (chart, above). With that, should this figure be taken out in the coming
days, then we would know that the next correction phase of this component is also
back in force. If that were to be triggered, then the recent 34-day upward phase
would have had to have formed the pattern of a ‘lower-high’, of which the low-end
statistical assumptions would favor additional weakness down to the 1254 area or
lower.”
Current analysis: As noted in past outlooks, taking out the 1289.00 figure favored
a test of the 1277.00 number, and taking that figure out to the downside then confirmed
the downward phase of the 34-day cycle to be back in force – which favored a drop
on down to the 1254 figure or lower. The latter was due to a normal low-end statistical
expectation in regards to the 34-day wave, when forming the pattern of a ‘lower-high’.
Noted in the prior outlook, there is the potential for a drop back to the 1230 area
before this wave bottoms, though any flip above the 1262.50 figure first, if seen,
would probably negate that assumption.
With the above, there is at least a decent shot that whatever low that is seen with
the 10 and 34-day cycles will end up as the low for the larger 72-day component.
Having said that, I can’t say this with any firm degree of certainty right now, simply
due to the weekly cycle’s forecast path (chart, above) – as well as various technical
factors, such as momentum. Even said, the one thing that the larger 154-day wave
tells us to expect is for any new upward phase with the 72-day component to end up
as a countertrend affair; in other words, the metal should remain below the 1392.80
figure. If correct, then we will see a full re-test or break below the December,
2013 bottom (1181.30) into what looks to be the month of August, plus or minus –
which would then set up the metal up for its next major low.
Copyright 2014, The Gold-Wave Trader & Forecast

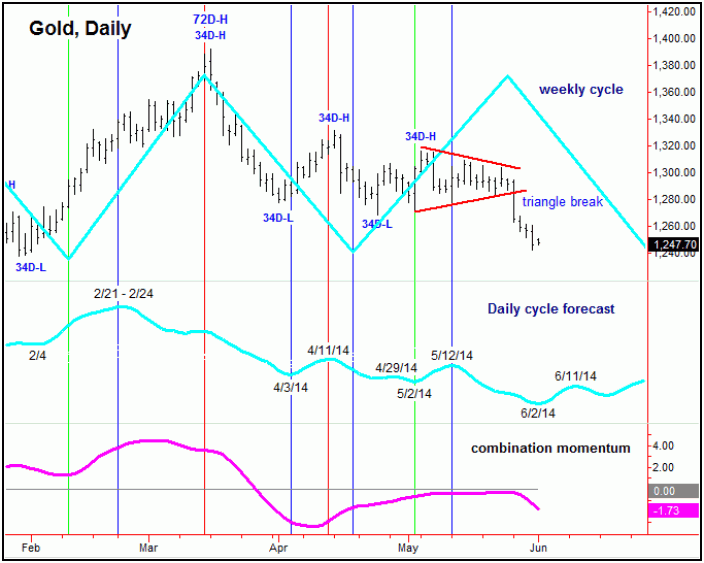
In looking at our daily/weekly forecast model (chart, above), as noted in the prior
outlook the low for the daily forecast had been adjusted slightly, with the model
looking for a short-term bottom around the 6/2/14 date, which is Monday of this week
and is plus or minus a day or so in either direction. Thus, the continued weakness
seen into Friday looks to be in line with the next bottom for the daily path – which
should also end up as the bottom for the 10 and 34-day time cycles. Having said that,
whether that low was made on Friday is too early to speculate, and with that I won’t
rule out lower numbers into the 1230’s into Monday.
With all of the above said and noted, the short-term path favors a bottom and at
least a sharp bounce into what is looking to be June 10-11, plus or minus. Any reversal
above the 1262.50 figure on Monday, if seen, would likely confirm that move up to
be in force, while remaining below the same allows for a continued break down to
the 1230’s.
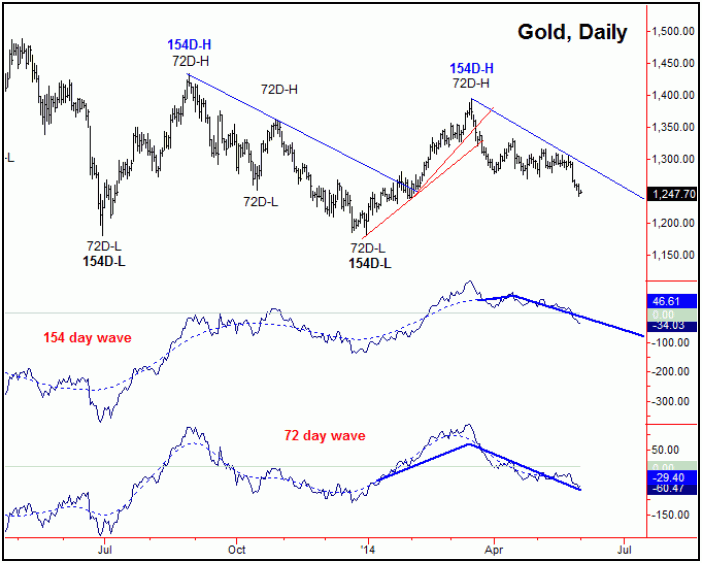
Stepping back, we have the weekly cycle pointing lower from the week of 5/23/14 into
what is looking to be late-June. As for the larger-degree 72 and 154-day cycles (chart,
below, I see both as pointing south at the present time, with both having topped
at the mid-March peak of 1392.80. Having said that, the smaller 72-day component
is now around 103 trading days along – and thus is due for a bottom. Originally,
I had thought that the mid-April low would end up as the low for this wave, though
the break below the 1268 area negated this assessment – and tells us that this wave
is still heading south.