Gold Market Stuck in Consolidation Mode
By Jim Curry - The Gold Wave Trader - 6/10/18
With the action seen last week, Gold is holding in a consolidation pattern at the
present time, with the same expected to give way to an eventual up-cycle phase into
mid-to-late Summer. Having said that, no larger turn has been confirmed, putting
us in 'wait-and-see' mode heading into the new week.
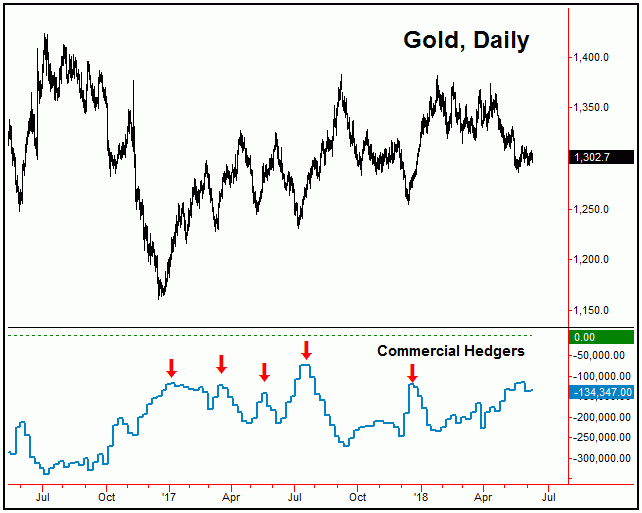
Commercial Hedgers Positioned for a Rally
As we move into the Summer months, the biggest bullish argument for Gold is the current
positioning of the commercial hedgers, which are holding one of their smallest net
short positions seen in recent years. Note that the hedgers are nearly always holding
shorts here, though the bigger the net short position the more bearish it normally
is for the metal. Conversely, periods where they are holding smaller net shorts are
normally areas where Gold will rally - which is the case at the present time.
In looking again the COT numbers from last week, the commercial hedgers scaled back
about 2,000 of their recent shorts, which brings their net total down slightly to
-134,347 contracts, with the data current as of the 6/5/18 close. This is near their
smallest net short position seen this year, as per the chart below:


Going further with the above, at the December, 2017 price bottom, the hedgers were
net short (approximately) -119,000 contracts, which led to a Gold rally of nearly
130 points into late-January of this year.
All said, the commercial hedgers are positioned for a rally - even though there have
been no particular confirmation that this rally is yet in play.
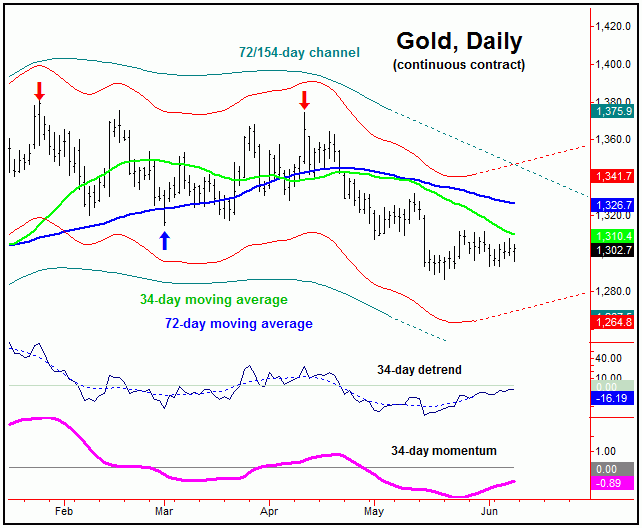
Gold's Short-Term Picture
For the very short-term, with the recent reversal back above the 1305.40 figure (August,
2018 contract) the upward phase of at least our 10-day cycle is deemed to be in force
- with at least the potential for the same to be true for the larger 34-day wave.
Having said that, to confirm the latter to have turned, price would need to see additional
strength - and a push on above the 1313.00 figure - which we are obviously still
trading below.

If we look at the price channel that encloses the larger 34-day cycle (chart, above),
what is interesting is that this channel is starting to curve to the upside, which
is an early 'hint' that this cycle has already bottomed - even though the best indication
is always a break above the reversal level (here, 1313.00, August, 2018 contract).
If the upward phase of this 34-day component is in fact already in force, then the
probabilities would favor additional strength on up to the upper 72 and 154-day price/cycle
channel.
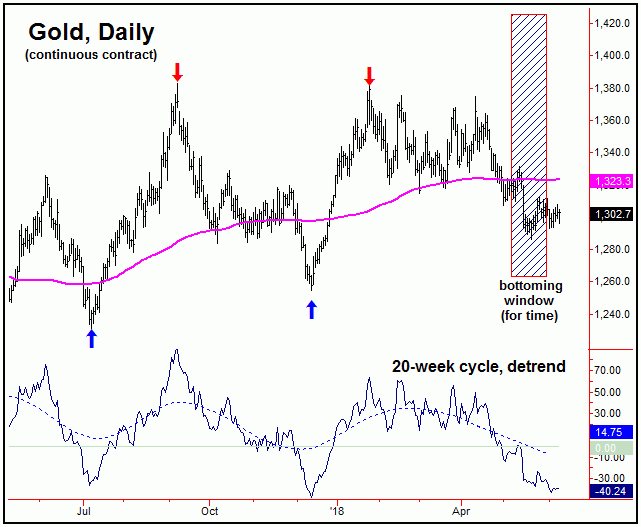
The 72-Day and 20-Week Gold Cycles
Stepping back then, from recent articles we know that our mid-term trough has been
due with the 72-day and 20-week time cycles, each of which have been in bottoming
range in recent weeks. Having said that, in order to actually confirm the next upward
phasing of these two cycles to be back in force, Gold would currently need to see
a reversal back above the 1332.00 figure (August, 2018 contract). This number could
continue to drop going forward - but would likely require a new price low for that
reversal level to move to a lower figure.
In terms of price, once the low is in place for the 72-day and 20-week cycles, then
the next upward phase of the same is expected to give way to a rally of at least
8% off the bottom, even though the statistical average has been considerably higher,
at 16% from trough-to-peak.
In terms of time, the ideal path would be for the next upward phase of the 72-day
and 20-week waves to last into the late-July or early-August timeframe, where the
next mid-term peak would be projected to form. From there, another sharp decline
would be favored to play out into the month of October, plus or minus, the past as
outlined in our original 2018 forecast issue.
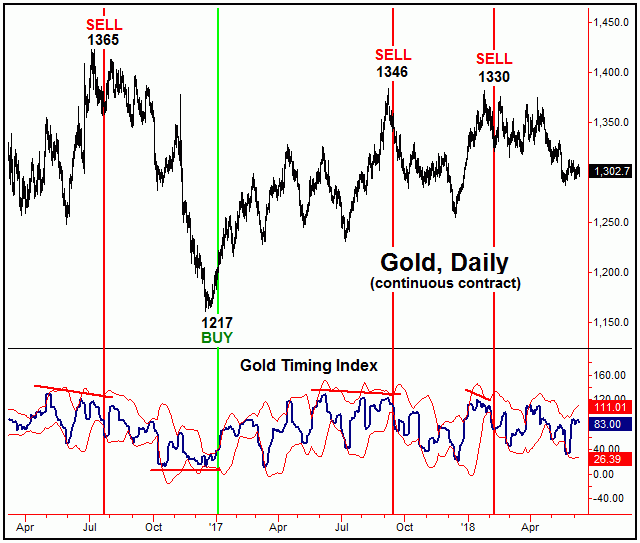
Gold Timing Index
The one problem for the mid-term picture has been the lack of a buy signal from our
Gold Timing index. That is, the best rallies tend to come after mid-term buy signals
with this particular indicator, and the best shorts tend to come following a sell
signal with the same. The last sell signal with our Gold Timing Index came back on
February 8th of this year, which was followed by the decline seen into the most recent
price trough of 1286. Here is an updated look at this indicator:
Going further with the above, buy and sell signals with our Gold Timing Index tend
to come following highs and lows with a larger 310-day time cycle that we track in
our thrice-weekly report.
There are two requirements for a mid-term buy signal to be seen with our Gold Timing
Index. The first is for a divergence to be registered between the indicator and price,
where price makes a new low - and the indicator itself does not. Since both the indicator
and price broke to lower lows at the most recent swing bottom, this divergence is
not yet in play, though any new price low, if seen going forward, would likely see
this divergence form.
Following a divergence between our Gold Timing Index and price, the actual trigger
for a mid-term buy signal would be for our indicator to close above its upper standard-deviation
band. I should add that, a close above its upper standard-deviation band - if seen
before a divergence has formed - has been a short-term sell signal for the metal.
The last time that this pattern was seen was back on 3/26/18- with Gold closing that
day at the 1366 figure.
With the above said and noted, though we are looking for a mid-term rally to take
hold with the 72-day and 20-week time cycles, the best 'look' would be for that rally
to be accompanied by a mid-term buy signal in our Gold Timing Index. Should it not
be accompanied by the same, then the anticipated rally would likely play out anyway
- though it would be suspect to a complete retracement of the entire move, once complete.
The Bottom Line for Gold
The overall bottom line for the Gold market has been the same as noted in past weeks,
which has the metal in the process of bottoming the 72-day and 20-week time cycles.
Once that low is set in place (if not already), then the probabilities will favor
a rally in the range of 8-16% into what is projected to be the late-July to early-August
timeframe. From there, another down (correction) phase should play out with these
two cycles into the October/November timeframe of this year, before bottoming out
for another rally into year-end, but likely holding up into the first month or so
of next year. Stay tuned.
Jim Curry
The Gold Wave Trader
http://goldwavetrader.com/
http://cyclewave.homestead.com/
Jim Curry is the editor and publisher of The Gold Wave Trader and Market Turns advisories
- each of which specializes in the use of cyclic and statistical analysis to time
the Gold and U.S. stock markets. He is also the author of several trading-related
e-books, and can be reached at the URL’s above.