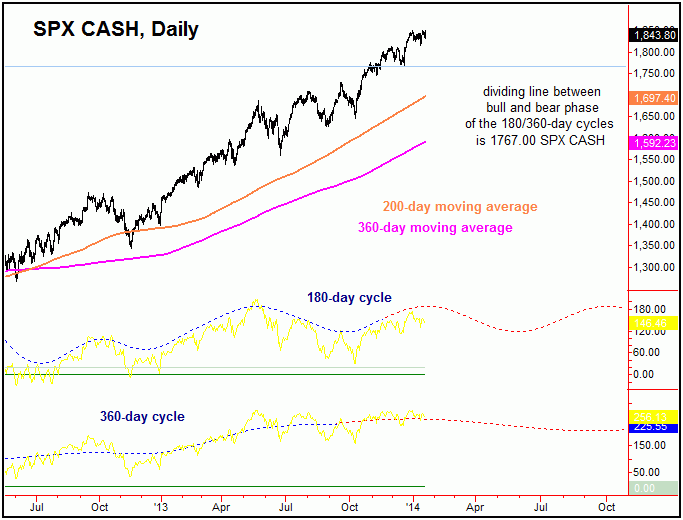
Right now, the current dividing line between up and downward phase of the 180-day
and 360-day cycles looks to be the 1767.00 SPX CASH figure (intraday). In other words,
if taken out at any point, then the probabilities would favor a larger-degree correction
to be in play with these waves into the June - November timeframe. In terms of price,
that would put the 200-day moving average as the minimum target, but with the lower
360-day moving average being the ideal.
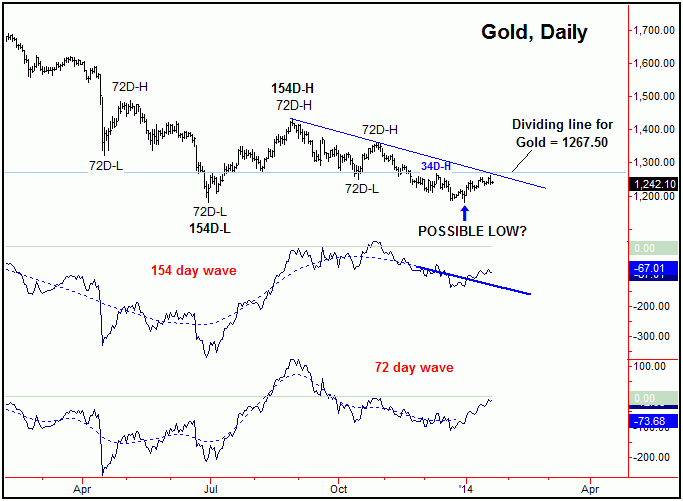
For Gold, I see the 1267.50 figure as the dividing line. That is the last peak from
a smaller 34-day wave, and taking that out to the upside would give above-average
odds that a larger rally is in play, one that would be favored to reach up to the
1430-1480 level or better, on a time peak not made prior to mid-March.
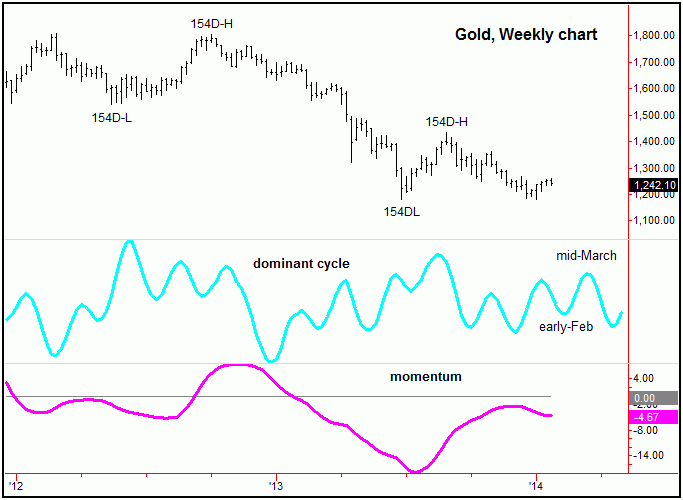
One way that the path could play out for Gold would be for a decline could play out
into early-February, ending up as a countertrend retracement. From there, we would
turn sharply higher into mid-March, which is where the dominant weekly cycle is projecting
strength (i.e., from early-February to mid-March, chart above).
Otherwise, remaining below the 1267.50 figure and the Gold still has some outside
shot that a run back to or below the 1181.40 swing bottom could play out into early-February,
plus or minus.