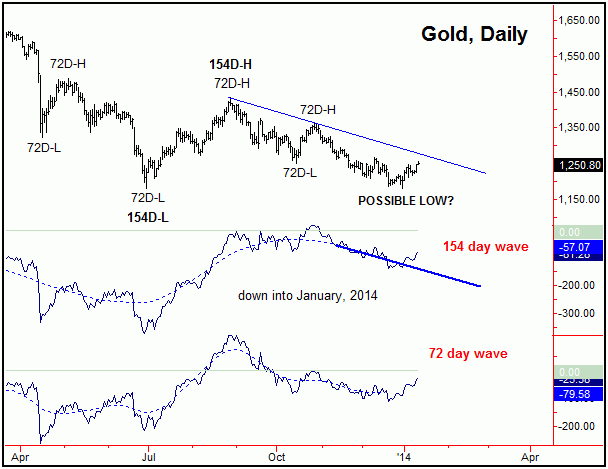
Overall, with the recent action it certainly ‘feels’ like Gold has made a 72 and
154 day low – doing so in a potential ‘double-bottom’ at the 1181.40 figure (i.e.,
a double-bottom from the June, 2013 low of 1179.90). Having said that, the problem
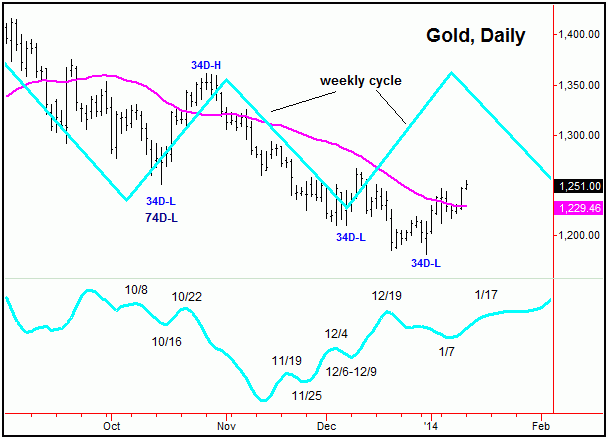
here is that the weekly cycle projection (chart, above) has been heading higher since
early-December, 2013 – and is looking set to peak anywhere in the current timeframe.
From there, it is projecting lower prices into around early-February, plus or minus.
If that should materialize, then the same would set up a near-perfect bottom with
these same 72 and 154 day waves, one which would also complete a good-looking Elliott
wave 5 pattern to the downside.
As for the daily cycle’s projection, this has been (and is currently) pointing higher
into the January 17th timeframe, plus or minus. With that, since we have had the
weekly topping – while the daily has been heading up – the same has made for choppy
action in the last week or so, but with an upside bias, due to the shorter-term daily
cycles.
Even with the above said and noted, the key again is whether the 1267.50 swing high
is going to contain the near-term upside. That is, if this figure can contain the
action in the coming days, then Gold can make one final move lower into late-January
or very early-February, as suggested by the weekly cycle projection. In terms of
price, that move would have the potential to reach down to the 1150’s, simply based
upon normal statistical inferences. If seen, that would then set up our Elliott wave
5 bottom, and would then be expected to give way to a rally to test the prior wave
4, which is the August, 2013 peak of 1434.10.
Otherwise, as noted in past outlooks, the only alternate here is that the 72 and
154 day bottom came on the early side – which is not out of the question, due to
the fact that the prior 154 day downward phase saw an extended rotation. In other
words, should Gold manage to take out the 1267.50 swing high in the coming days,
then that path would moved to the favored scenario – one which would put our (Elliott)
wave 5 bottom already in place.
Stepping back further, as originally pointed out a week or so back, the average 154
day cycle upward phase – when coming off the pattern of a ‘lower-low’ – has witnessed
a rally of around 25% off the bottom. In other words, taking out the 1267.50 figure
would suggest that a rally back to the 1480’s or better is in play, which is at or
not too much above the prior-labeled wave 4 (i.e., 1434.10, chart above).
In terms of time, when the aforementioned 154 day cycle came off the pattern of a
‘lower-low’, then the normal low-end rally with the same lasted 50 trading days or
more, while the average was closer to the 83 day mark. In other words, taking out
1267.50 on Gold, if seen at any point, would suggest a rally in force that would
be favored to last into mid-March of this year. Note that this does tend to line
up with the weekly cycle’s projected path of a mid-March high.
All said then, the new week should prove to be very important for the overall action
– particularly the closer we get to January 17th, plus or minus. If 1267.50 is able
to hold the upside, then a lower low for the bigger swing is favored into early-February
(plus or minus), then to set up a major bottom with the 72 and 154 day waves (chart,
above), then to be followed by a rally in the range of 25% or more, lasting several
months before topping.
Otherwise, taking out 1267.50 first, if instead seen, would tell us that our larger
combination bottom is already in place – and that a rally into mid-March (or later)
should continue to unfold, with the 1430-1480’s or better acting as an upside magnet.
Taking out 1267.50 then would also have me looking to buy minor cycle bottoms on
the short-term daily chart.
Jim Curry
The Gold Wave Trader & Forecast
Email: mailto:goldwavetrader@gmail.com