Gold Bracing for a Short-Term Correction
By Jim Curry - The Gold Wave Trader & Forecast - 7/10/14
In my prior article from back in early-June, I noted that a short-term bottom was
due, which had been projected for the June 2nd timeframe, plus or minus a day. The
actual low for Gold was registered the very next trading day, doing so on June 3rd
at the 1240.20 figure. Since then, we have seen a rally of over $100 playing out
with the metal, which is now looking for a short-term correction in the days/weeks
ahead.
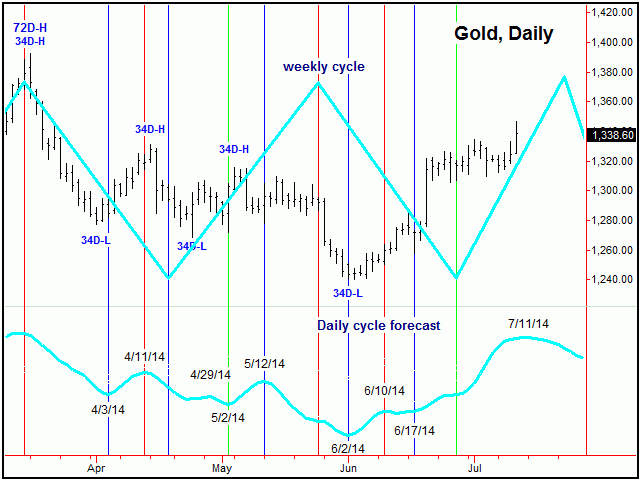
Take a look again at the chart below:


The chart above shows the daily/weekly cycle forecast path, which is shown in aqua.
This chart is simply a combination of the dominant cycles that track the Gold futures
contract, projected into the near future. Of note is that the next forecast peak
for the short-term daily cycle is due right around the current timeframe - set for
July 11th, which is plus or minus a day or so in either direction. From this high,
the metal is projected to be weaker into what is looking to be later this month (exact
date still tentative).
On the above chart, the most important periods are when both the daily and weekly
forecast paths are moving in the same direction. The green vertical lines show when
both forecasts are moving higher, and the red lines are when both models are forecasting
lower prices. A blue vertical line is shown when the models are in disagreement (i.e.,
a ‘neutral’ condition).
With the above, we can see that when both forecast paths are in alignment, the market
tends to move strongly in that direction. I should add that, when the daily and weekly
forecasts disagree, that the market has more of a tendency to follow the shorter-term
(daily) forecast path - but only when technical action is in agreement.
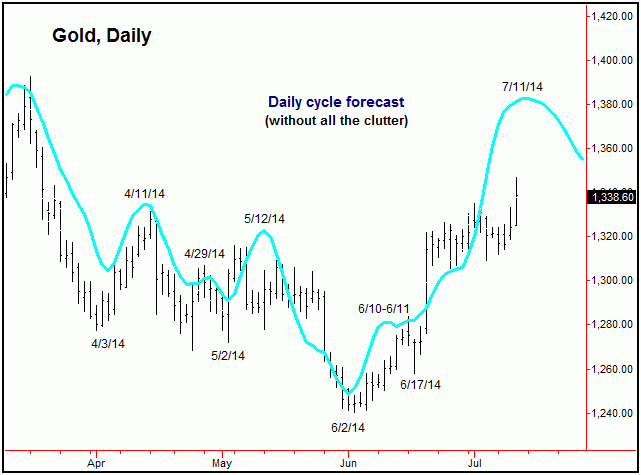
Take a look now at our next chart:
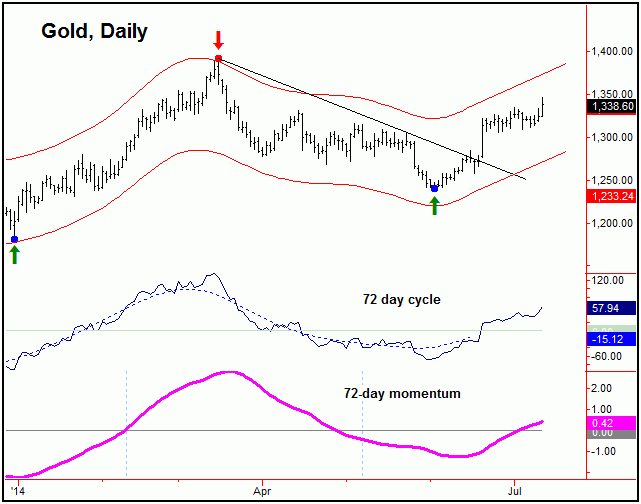
Stepping back, there is an even-larger 72-day cycle (shown above) for Gold, one that
also bottomed at the 6/3/14 low - and thus is heading higher off the same. With that
configuration of this larger wave, the probabilities tend to favor the whatever correction
phase that is seen with the 34-day component to end up as a ‘higher-low’ – remaining
at or well above the 1240.20 figure.
If the above assessment is correct, then the current speculation is that a low with
the 34-day cycle around mid-to-late July, if seen, would then give way to another
run to or above the recent swing top on the following upward phase of this component.
If that should materialize, this would then set up the next peak for the larger 72-day
cycle into August, prior to a sharp decline phase into what is now looking to be
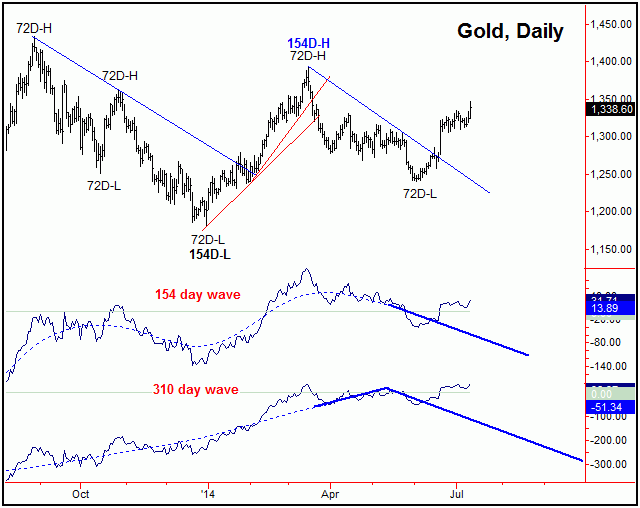
the month of September, where the larger 154-day cycle is next due to trough.
The chart above shows the 154-day wave, as well as an even-larger 310-day component
- the latter of which is less dominant. With that, though still a bit sketchy at
the present time (since we can look only so far out with the various cycles), it
looks like a September bottom with these waves, if seen, should give way to the strongest
rally of this year. If whatever low that ends up being seen with the 154-day wave
is able to remain above the 1181.00 figure (which is the prior trough for this component,
back back in December, 2013), then the cycle will have formed the bullish pattern
of a ‘higher-low’. And, when this pattern has been seen in the past, the probabilities
are in the range of 80%-or-better that the prior top for the cycle (i.e., currently
deemed to be 1392.80) will be taken out on its next upward phase.
The bottom line with the above is that while Gold was due for a rally back in early-June
(where the cycles were bottoming), it is now looking for a short-term correction
in the next week or two, ideally coming from the 34-day cycle. At that point, the
assumption is that decline will be followed by another run at the highs on the next
upward phase of this cycle, then to peak the larger 72-day component.
Jim Curry
The Gold Wave Trader
http://goldwavetrader.com/
Jim Curry is the editor and publisher of The Gold Wave Trader, which specializes
in the use of cyclic and statistical analysis to time the markets. He is also the
author of several trading-related e-books, including ‘The Volatility Reversal Method’,
also ‘Cycles & Moving Averages’. He can be reached at the URL above.
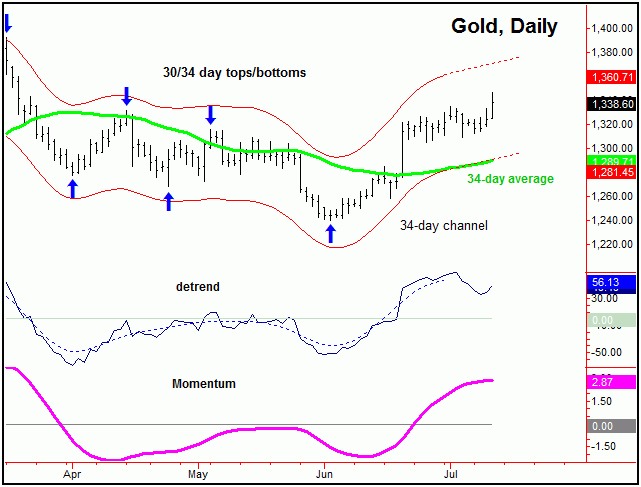
The above chart shows and isolates the 34-day cycle, which is the wave that is favored
to top the daily cycle’s forecast. The particular cycle is currently 28 days along
from the 1240.20 low, which was registered back on 6/3/14. With that, this wave is
in normal back-end topping range, and is due for a decline phase into mid-to-late
month, plus or minus.
For the near-term action then, the next decent move for the metal is favored to be
a correction with the 34-day cycle into later this month. In terms of price, the
ideal path would be for a minimum decline back to the 34-day moving average into
the third week of July (plus or minus), simply based upon the fact that a cycle will
revert back to a moving average of the same length better than 85% of the time.
Having said and noted the above, we can also go into a statistical analysis of this
same 34-day cycle, to see what we may be able to expect. With that, the greater-majority
of the downward phases of this particular cycle have seen a decline of 4.3% off the
top before bottoming. In other words, should the peak for this wave be made at or
near current price levels - something which is still up in the air at the present
time - then the probabilities would favor a drop back to the 1270-1280 area into
later this month. As a side note, there is also a gap left over from the 6/18/14
close (i.e., around 1272) that could act as a potential downside magnet.
In looking at short-term momentum that tracks this same 34-day day cycle, the same
is looking set to roll over in the coming days. With that, any flip back below the
1309.40 figure on Gold, if seen, would likely signal that additional follow-through
lower with this 34-day cycle component, with that 34-day moving average and/or 1270-1280
area in mind.
The chart above shows the daily cycle forecast, this time without all the clutter.
That is, in taking away all of the vertical lines and text (and also the weekly cycle)
and then overlaying the forecast over top of price action, we can see the model has
been extremely accurate in past months. (if there is anything that has been more
accurate at forecasting the daily price action of Gold this year, I am unaware of
it!). Of course, there is never a guarantee that the near-future will be like the
near past.
Going a bit further with the above, while I won’t always trade the forecast turns
as shown (as I also like to follow the accompanying technical action) – I certainly
want to know where the cycles are headed. Combining the above with the various time
cycles and statistical information derived from each wave, we have been able to get
a pretty good idea of where this market has been heading in the year 2014.